I’m here,
I’m here,
Are you there?
Adrift is an art installation that visualizes the invisible global Internet infrastructure by measuring connectivity time and locations of random Internet connection points.
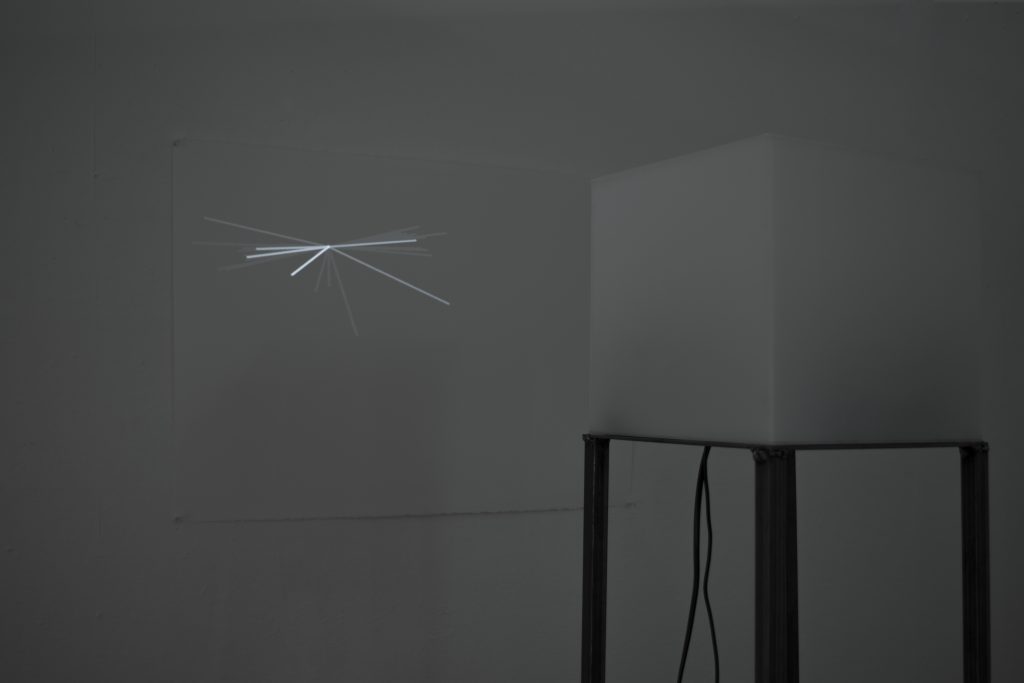
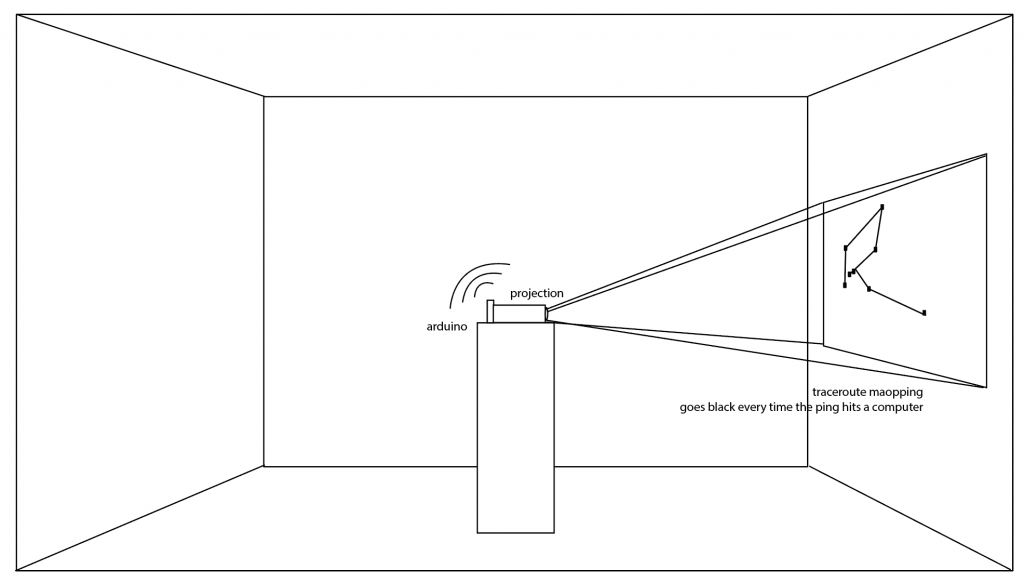
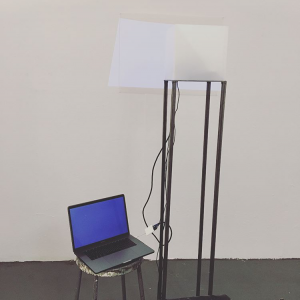
A steel sculpture, a glowing white box, a traveling signal, and a projected live drawing invite viewers to think about Internet patterns.
From Parsons Fine Arts, studio 36, NYC, 40.0128°, – 73.0060° a signal was sent to the world, to wonder endlessly on the underground channels of the Internet infrastructure. Randomly bouncing from IP to IP, the signal shoots out across the world, waiting for the echo of another Internet connection point, carrying a single question: I’m here, are you there?
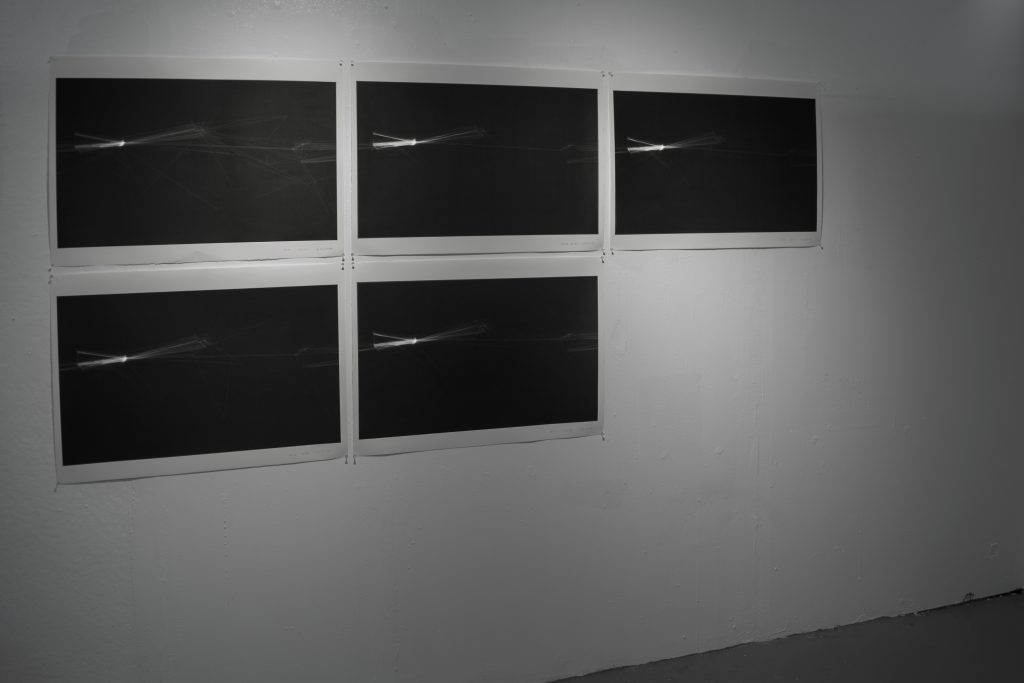
Each time the white box emits a light blink the signal return home and it’s sent back to another quest. Each time the light blink is prolonged another computer has responded. With the response, the geolocation of the reached out IP is requested to an API service, and the received coordinates are translated to a live drawing, a line to and from the location of the other computer, to the location of this computer.
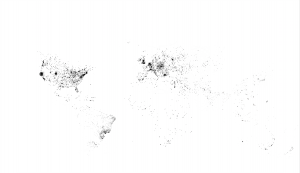
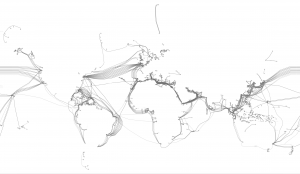
While the blink rhythm attest to transmission time and world distances, the live drawing allows one to see a physical representation of online space in this particular moment; making the immaterial, material. This drawing functions a statistical representation of the uneven distribution of Internet access and control in the world. It is a geopolitical portrait of the Internet, a record of light and time from a given perspective. It maps the world but also map this computer in relation to it, its own existence. As a site-specific artwork, or as a lab experiment, the visual results would be different with the work installed in another world location.
The project Adrift comes from the need for connection, a basic human need, aiming to reconnect the alienated digital body. It is a project about sociality; contact being what forms the image.
Process:
The project was conceived for an art space, for art visitors as the audience.
During the semester I worked on a research trying to understand the Internet infrastructure: where is it, who owns it, which laws apply to it, how files travel on it, and how much time they take.

I wanted to make a work that would take the form of a representation of a live performance happening on the world, on the Internet infrastructure. I wanted to make a work about connectivity and the lack of it, to show the uneven Internet distribution and to reclaim visibility and importance to servers’ locations, to the geopolitical structure of the Internet, to this new form of colonization that as users we are less prone to notice or care.
I envisioned different project ideas that consisted mainly of a server network and a file traveling on it, while different visualizations would happen in the exhibition space.
During the research I found Nicolas Maigret’s project Internet Encephalography.
http://peripheriques.free.fr/blog/index.php?/works/2011-internetencephalography/
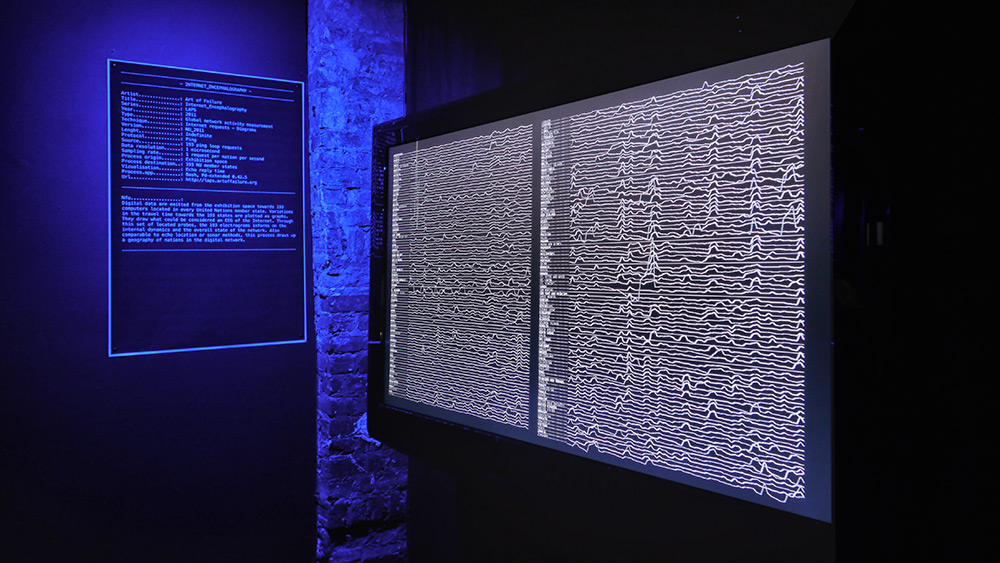
The project consist of a computer in the exhibition space sending Ping signals to 193 computers located in every UN member state, measuring the time it takes to the signals to get to their destination and visualizing this time.
When I encounter this project I realized that using the Ping command was a very smart way to measure connectivity and location of computers while only controlling one connection point with a relatively simple setup.
I decided then that I would have a single signal travel endlessly around the world, and a geolocation trace of it’s traveling in order to create an abstract map on the Internet.
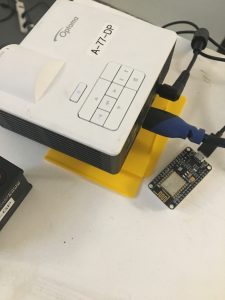
For that I first started researching how to connect to Internet with Arduino and perform a Ping command. I found out that esp8266 are great modules for connecting to Internet. I first started to work with a NodeMcu module.
The first challenge was to set up Arduino IDE to recognize my module and then to download the driver to my computer in order to work with the USB to UART port.
To install the board I use this tutorial:
https://github.com/esp8266/Arduino
And I downloaded the driver from here:
https://www.silabs.com/products/development-tools/software/usb-to-uart-bridge-vcp-drivers
Once I could connect successfully to my module I started to see how to connect to the Internet and after several trials I managed to connect to my iPhone hotspot. Since I didn’t manage to connect to The New School Wi-Fi, in order to have the installation in my studio I had to connect to my phone Wi-Fi.
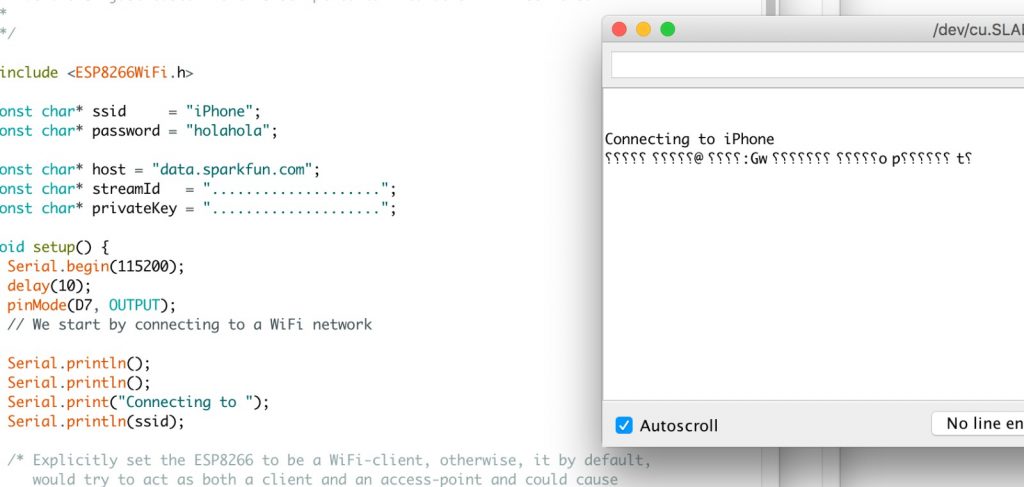
For connecting my module to Wi-Fi I used the ESP8266WiFi library. A tutorial for that is here: https://tttapa.github.io/ESP8266/Chap07%20-%20Wi-Fi%20Connections.html
Once I got the module connected to the Internet I started to see how I could perform a Ping command. After several trials I found this repository that worked: https://github.com/dancol90/ESP8266Ping
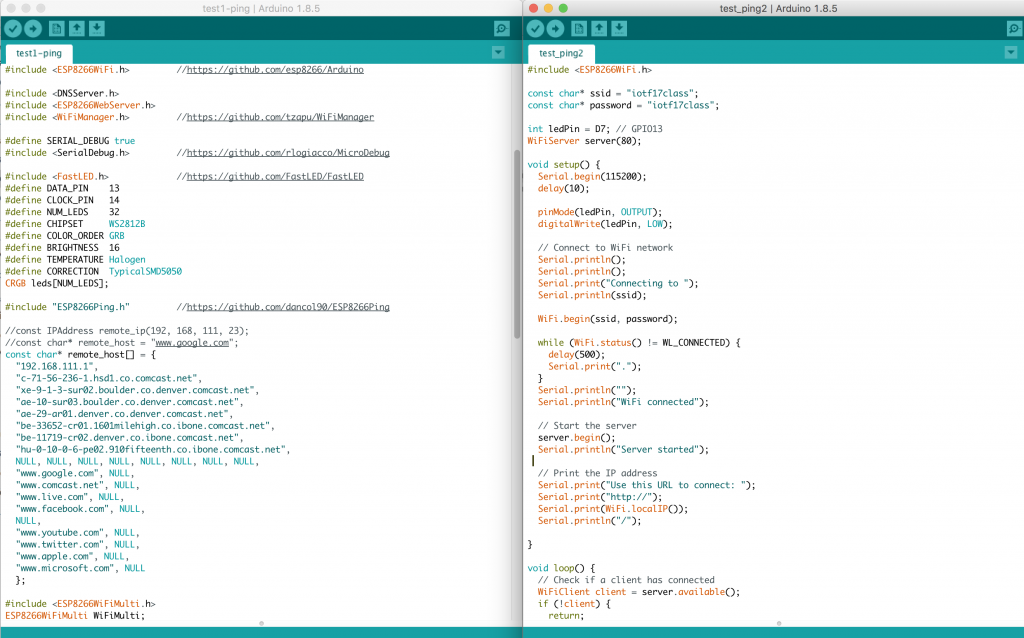
It was a challenge to make the Ping perform with a dynamic IP but after a wile it was successful.
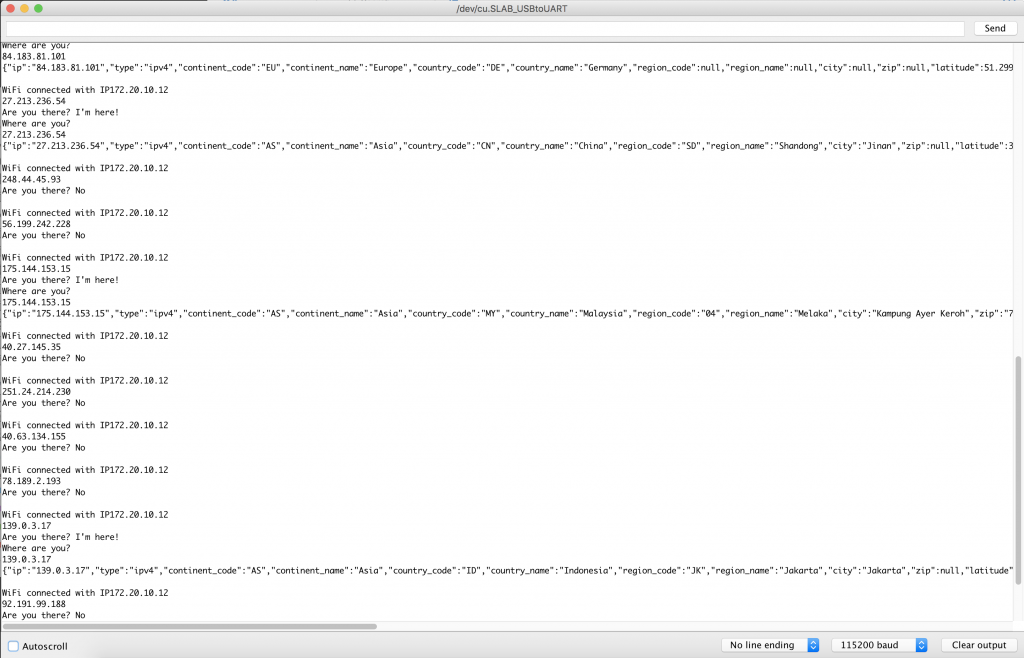
The next milestone was to retrieve the Geolocation coordinates of a successful Ping. I tried many repositories but nothing was working. At this point I found out that the Adafruit module had better documentation and I migrated to it. I though I would need to recreate all the work done until this point for the new module but the code I created until now worked perfectly in the new module.
With the new module it was still hard to make the Geolocation repositories for esp8266 modules work with a dynamic IP number. I was trying to work with this tutorial that works with the Geolocation API freegeoip.net: https://github.com/m0xpd/ESP8266-GeoLocation/blob/master/ESP8266_GeoLocate_1.ino
The DT tutor Tuba Ozkan helped me to find the solution by sending a directly a request to an API using this tutorial: https://techtutorialsx.com/2016/07/17/esp8266-http-get-requests/
We worked with ipstack.com API
Successful Geolocation code: https://drive.google.com/open?id=156_87Qrz2c00j9cT9bkYj60L_-yi_WCE
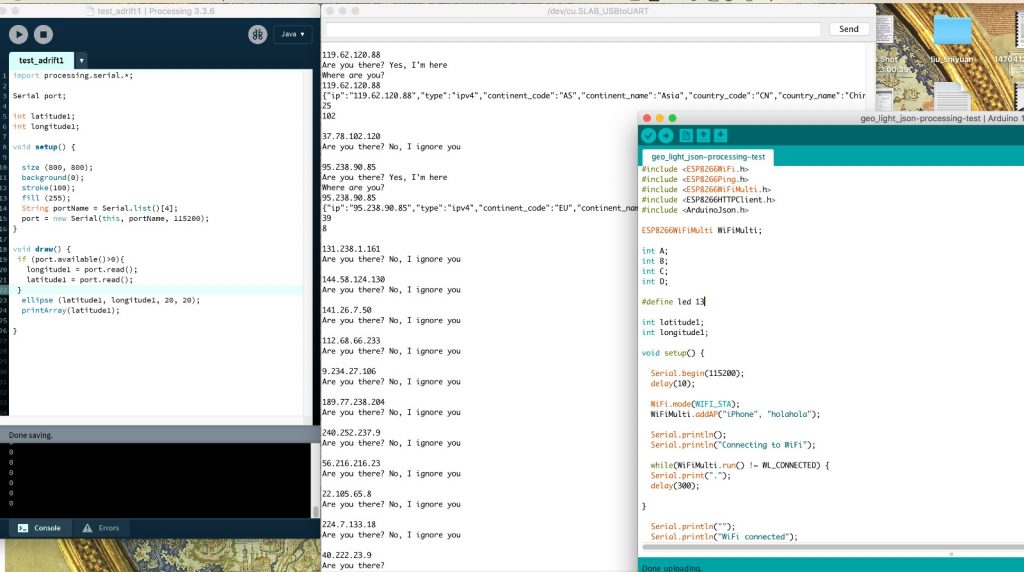
Then the challenge was to make the received Json data readable to Arduino and to change variables according to the receive data. I followed the Arduino tutorial for Json using the ArduinoJson library: https://arduinojson.org/example/string/.
![]()
![]()
Successful Json parsed Geolocation code: https://drive.google.com/file/d/1Sq2qMVS3DY90_1roXLvza4xzuL75taWk/view?usp=sharing
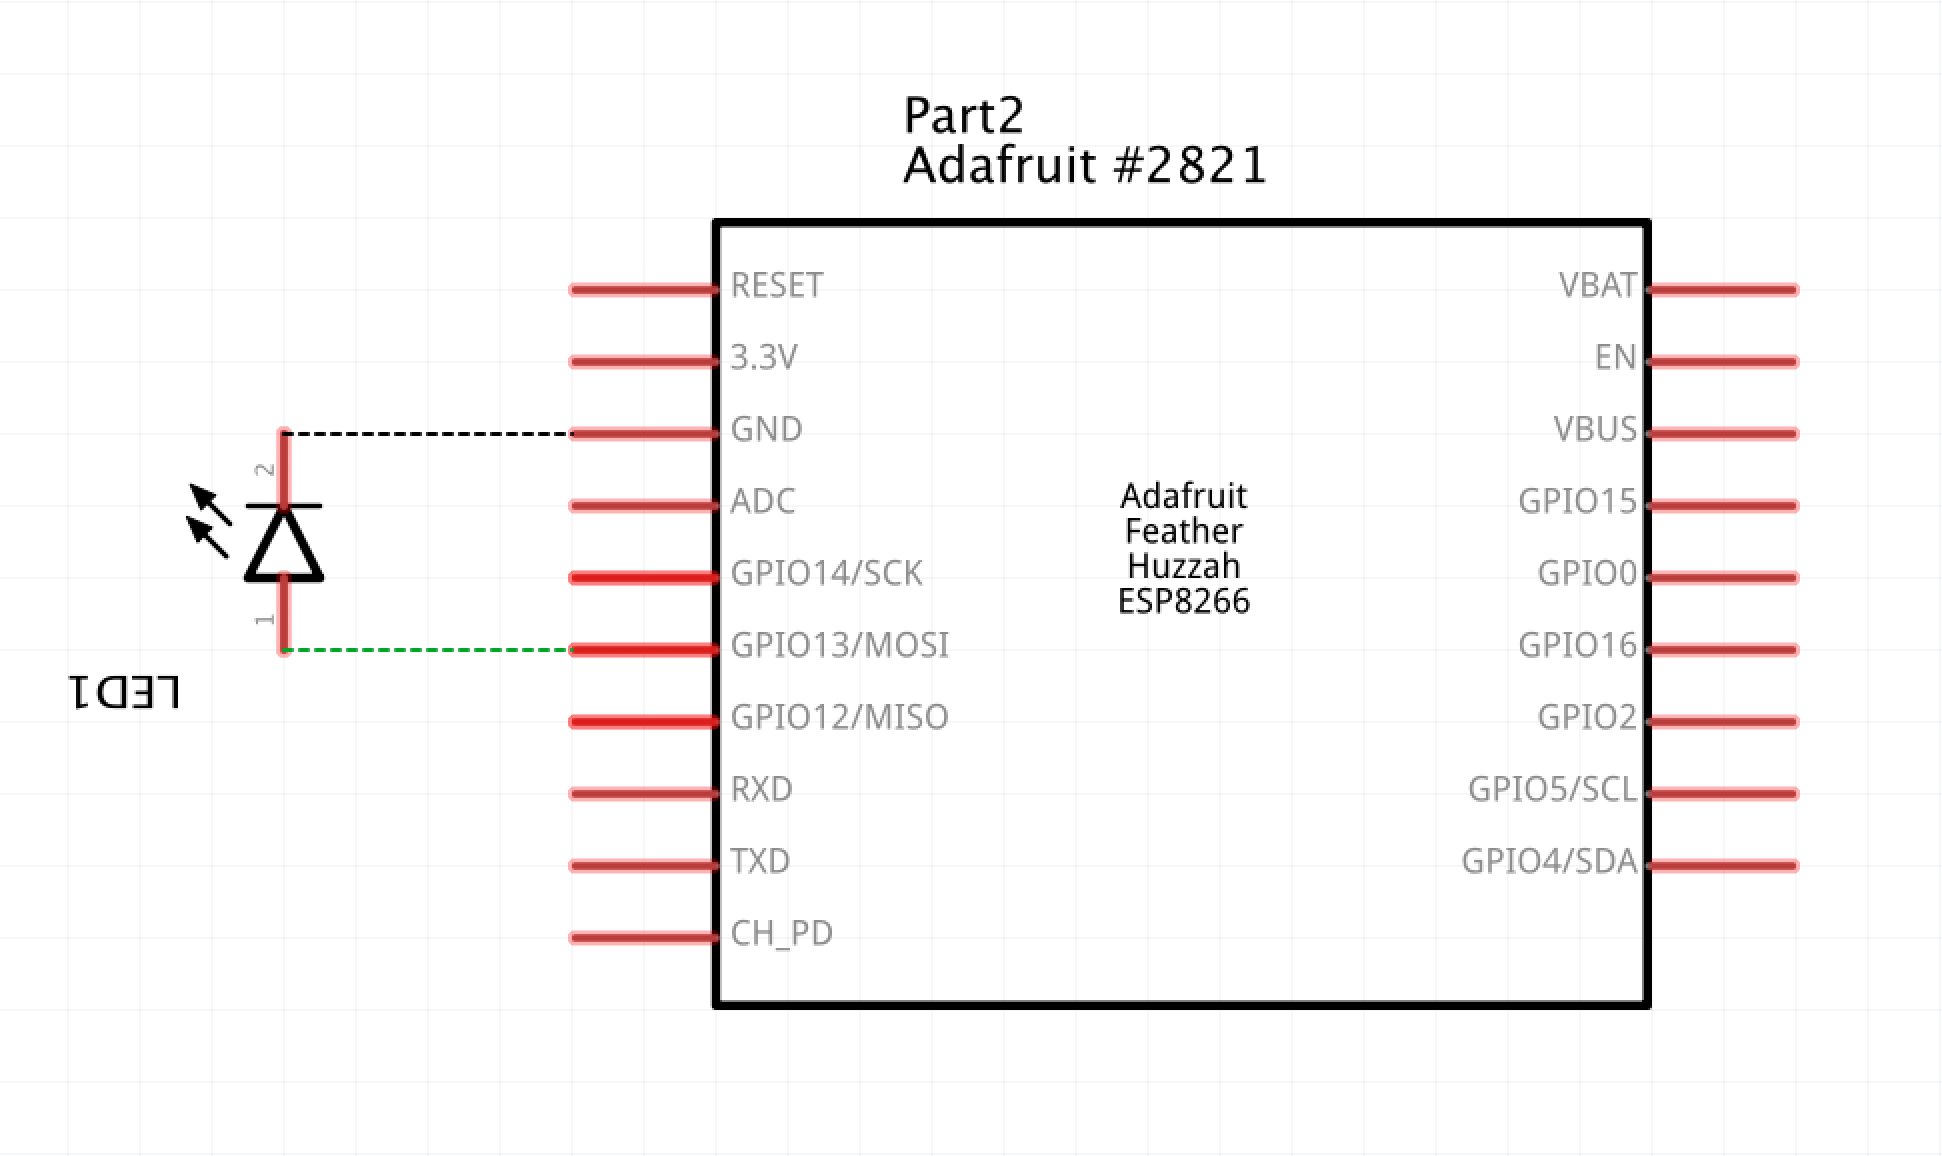
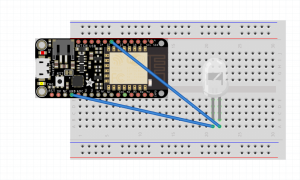
At this point the main functionality was ready and I started to work on how to visualize the data. The first thing was to create a light feedback. To add a led light is very simple but I found out that how to define a pin is in my module is different than how to do it in Arduino, they need to be defined at the beginning of the code.
Following that, I started to work on the live drawing. My original idea was to have a custom laser projector that would display the signal positions over a photosensitive paper, which would be developed after a period of time, condensing the traveled positions over time. I realized that in the timeframe it was not possible to achieve this task so I decided in the meantime to work with a consumer projector connected to a mini mac running Processing. I then started to work on connecting the two software. I worked with this tutorial: https://learn.sparkfun.com/tutorials/connecting-arduino-to-processing
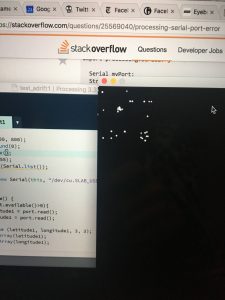
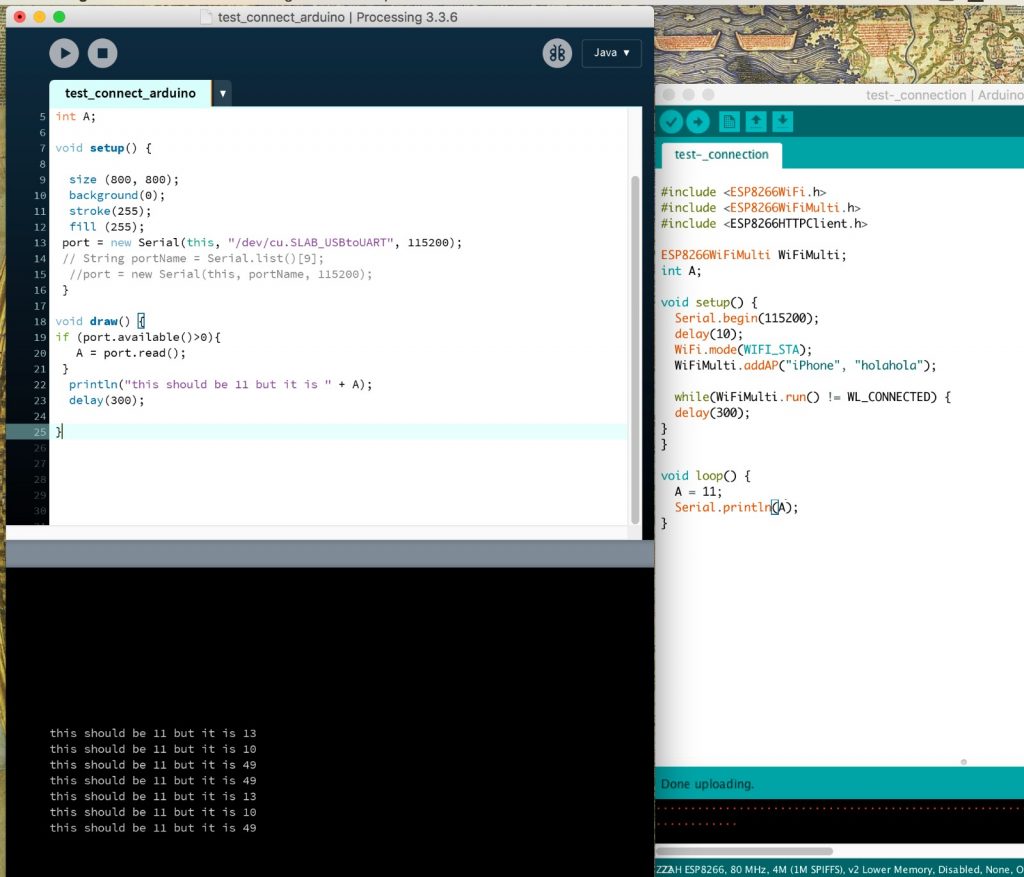
I received many errors until I found out that Processing would not receive Arduino’s data if its serial monitor was open because the connection to Processing and to the serial monitor is through the same port.
After I managed to connect the two platforms I realized Processing was receiving more data that supposedly Arduino was sending. I was very frustrating until I realized that the Serial.println function was not only helping me see what was going on in the serial monitor but it was also sending data to Processing. I erased or commented all the Serial.println functions and used a Serial.write function to store the variables and sending them to Processing.
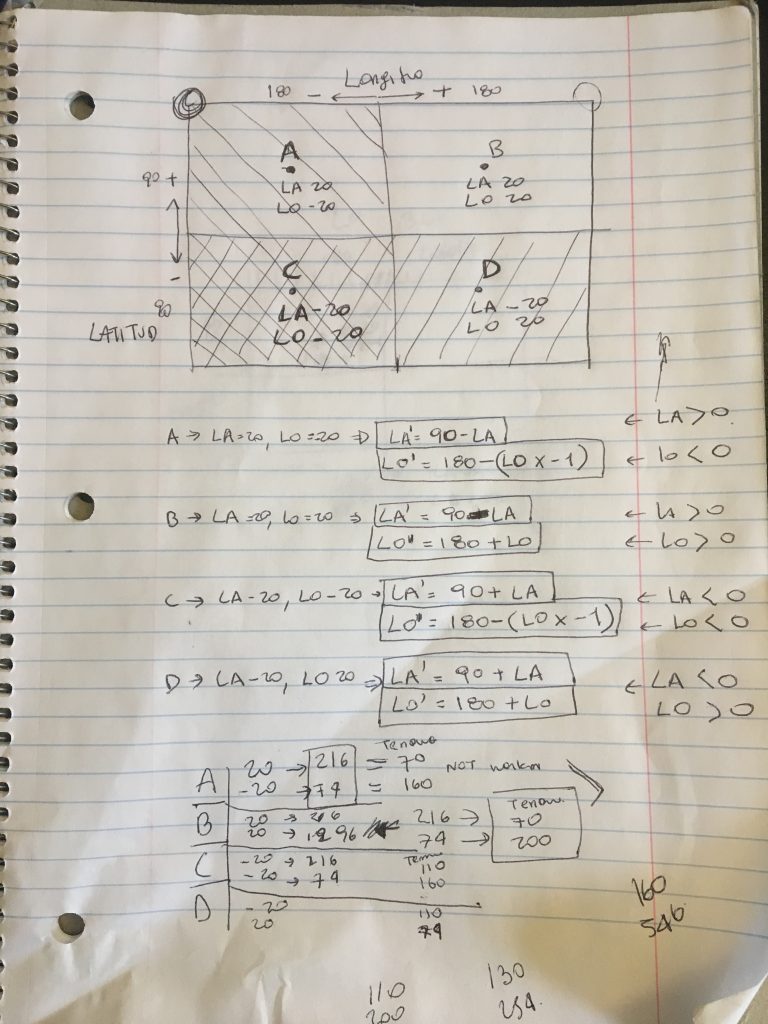
Once the data was successfully received, I observed that negative coordinate numbers were translated to positive. I could not just invert the numbers but had to work with the coordinates numbers logic and create a different equation for each of the four categories of coordinates numbers (latitude positive, latitude negative, longitude positive, and longitude negative) so they are correctly placed in Processing canvas starting from the 0,0 position instead of the canvas’ center. I also had to convert the positions in Processing so they adapt proportionally to the canvas size.
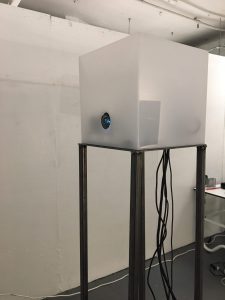
The sculpture design process was held simultaneously to the coding development. The size and materiality of the box containing the device was designed to contain all the elements that would go inside it.
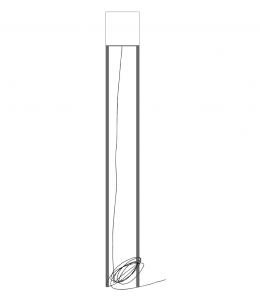
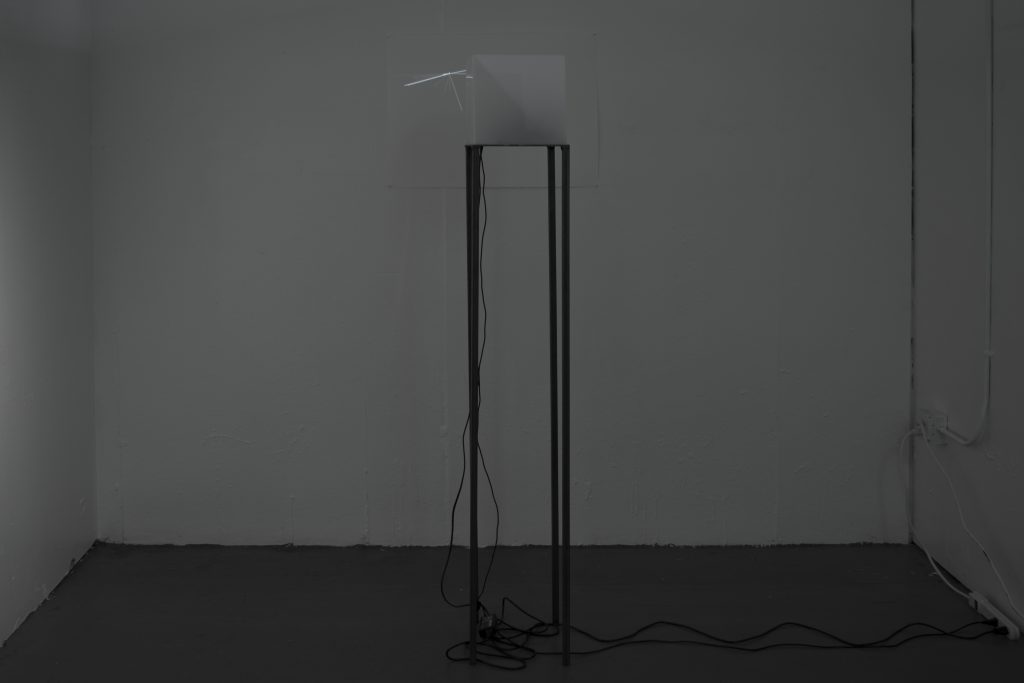
For the material design decisions, three matters were considered. The first is the low volume of the piece. In order to contrast with the incommensurable size of the Internet infrastructure, I wanted to create a minimalistic experience, a work that would not scream but whisper.
The second one is the bodily size. Measuring 5.9 feet tall and 11 inches on side and depth, the sculpture relates to the body in the exhibition space. This relation aims to reflect on the human desire for connection and on the singular perspective by which the Internet is being mapped in the work.
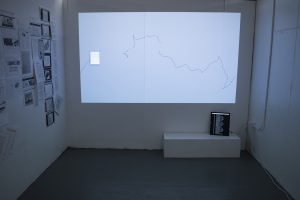
Lastly, I wanted to engage with the art mediums and historical materiality. The decision to make a drawing projected over a fine arts paper is result to that.
Once I got the sculpture ready and the esp8266 functioning I started the playtest process in the installation space. In this process the size of the drawing, the color of the paper, and the location of the sculpture in the space where decided.
Looking into the future, I plan to work on the custom laser projector and I want to test it on a photosensitive paper in order to create condensed portraits of the Internet infrastructure.

Final code:
Arduino: https://drive.google.com/open?id=1gvsCpzRmhyANXL6rbF0pKHKfqNoFFW1R
Processing: https://drive.google.com/open?id=1lCSthiHSNuzqiGKW9oFkX0Pha4e5Oabh
Materials:
One Assembled Feather HUZZAH w/ ESP8266
https://www.adafruit.com/product/3213
One 10mm Super Write White LED
https://www.amazon.com/gp/product/B01CI636KO/ref=oh_aui_detailpage_o01_s00?ie=UTF8&psc=1
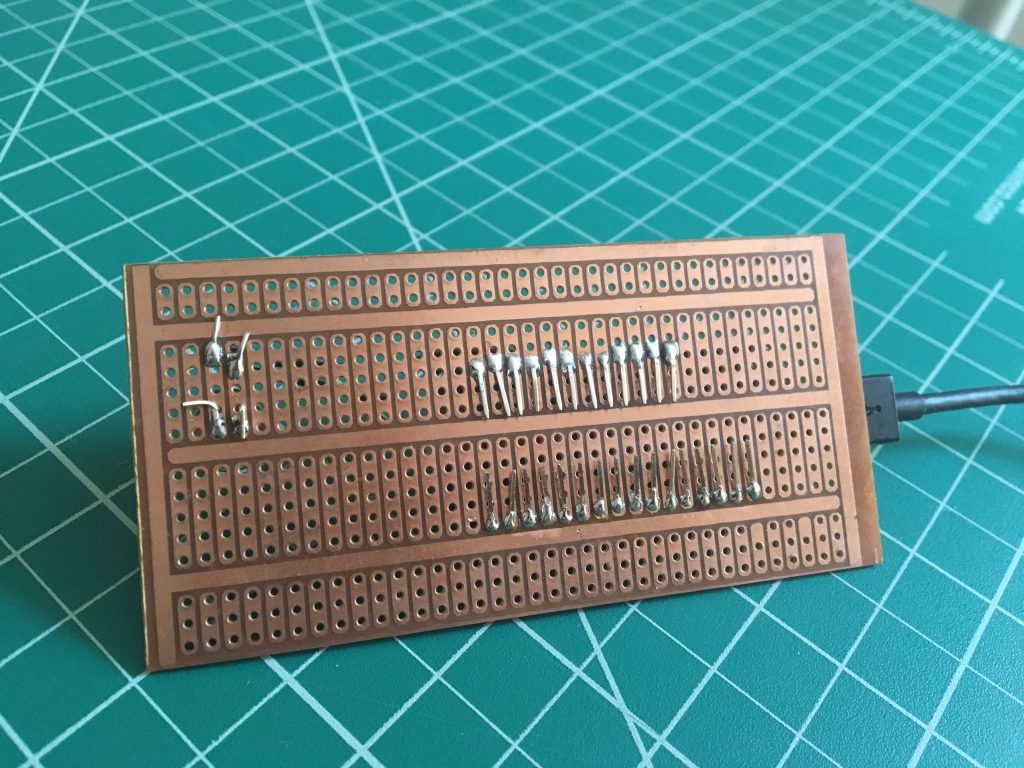
One Perf-Board and wires
Three sheets of 12” x 24” white translucent acrylic sheets
https://www.canalplastic.com/collections/plexi-sheets/products/2447-white-translucent-acrylic-sheet?variant=32920754318
One Cold Rolled Sheet Steel (2′ x 2′ x 11 gauge)
And two Square Tube Stock 1/2″ X 1/2″ x 12′
Class project presentation: https://drive.google.com/open?id=1gbfiU5HuFinWEO6UxA9I9uXgK-sP16Jc