Sun and Moon—data visualization
Hi, there,
What better to do than build circuits when there’s a hurricane raging outside?
I built a circuit using a photocell and a button. Interestingly enough, the initial sketch I did just to see the data coming off the photocell showed six lines of data coming off the sensor, only one of which actually seemed to react to the change in light. Here’s a screen capture of that sketch, which shows the changing data as I bob my hand up and down over the photocell.
As a result, I eventually created a sketch that would save a designated number of the last signals sent from the Arduino, and then average them. When that array had 600 elements, the movement was very delayed from the changes in light, but was very smooth and I liked the effect.
When I re-wrote the sketches to allow for two sensors, I no longer got the noisy data from the photocell, and I’m not sure why. The final sketch therefore still uses the averaging method to smooth the animation, but I used only 50 bytes of data from the Arduino, rather than 600.
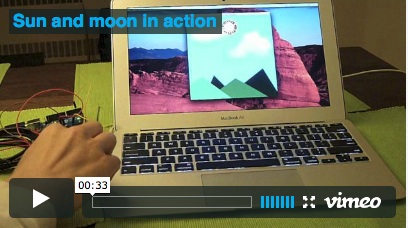
In the final sketch, the animation reacts to the light coming into the photocell. If the button is not pressed, then it shows a day scene, with the sun rising and setting with more and less light, and the sky color changing accordingly. If the button is pressed, then it switches to a night view, and the moon does the opposite.
Here is a movie showing the sketch in action:

Finally, here’s the video of my computer and the circuit setup:
The code is in my github repository here. If you’re dying to see earlier renditions of this, you can see them in this folder, which I uploaded before I changed the name.