Week9 / Realtime Data Visualization
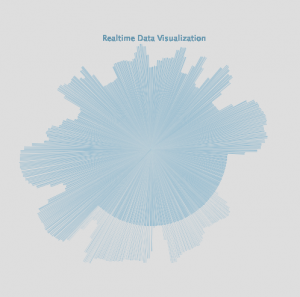
I made Realtime Data visualization using an arduino, processing and sensor input. I try to tested flex sensor,force sensitive resistor, photocell and tilt sensor. Finally, I used force sensitive resistor and other sensors are sensitive so did not work very well.
- Instruction -
Circle automatically be drawn center of stage.when you pressed force sensitive resistor, circle shape draw little bigger and when mouse is clicked, it will reset to new start.
